All Labels and Events
Results from Each Event Individually
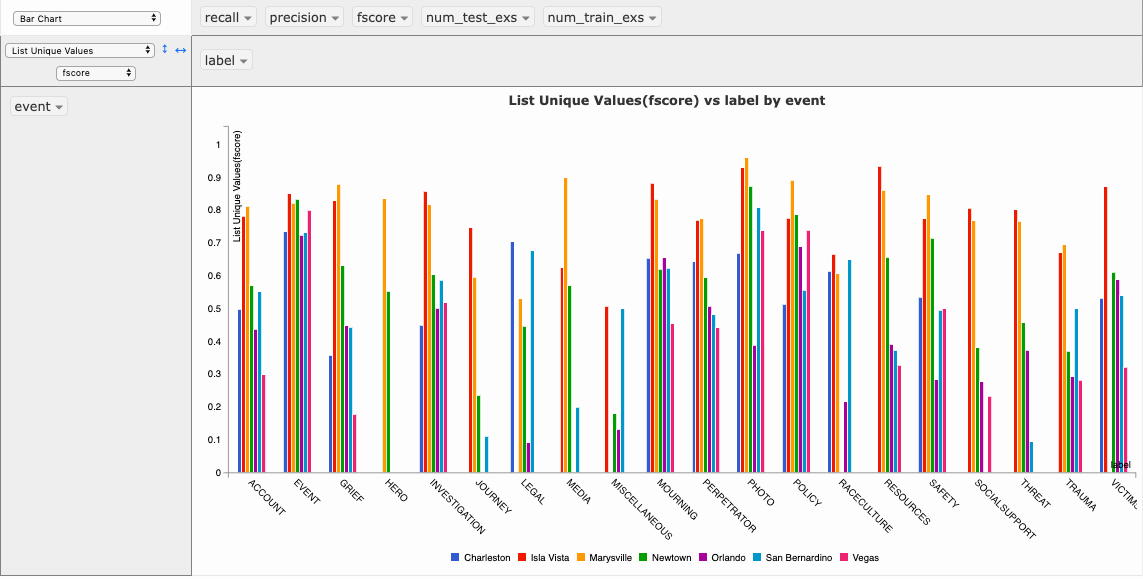
The following two links lead to interactive visualizations of the results for each event individually. The suggested use of the table is to drag “event” to the left column and “label” to the upper bar. Then select a viewing option, such as bar chart, and select to view “list unique values”, and then select “fscore”. The image below shows how to configure the options on the table to display the results.
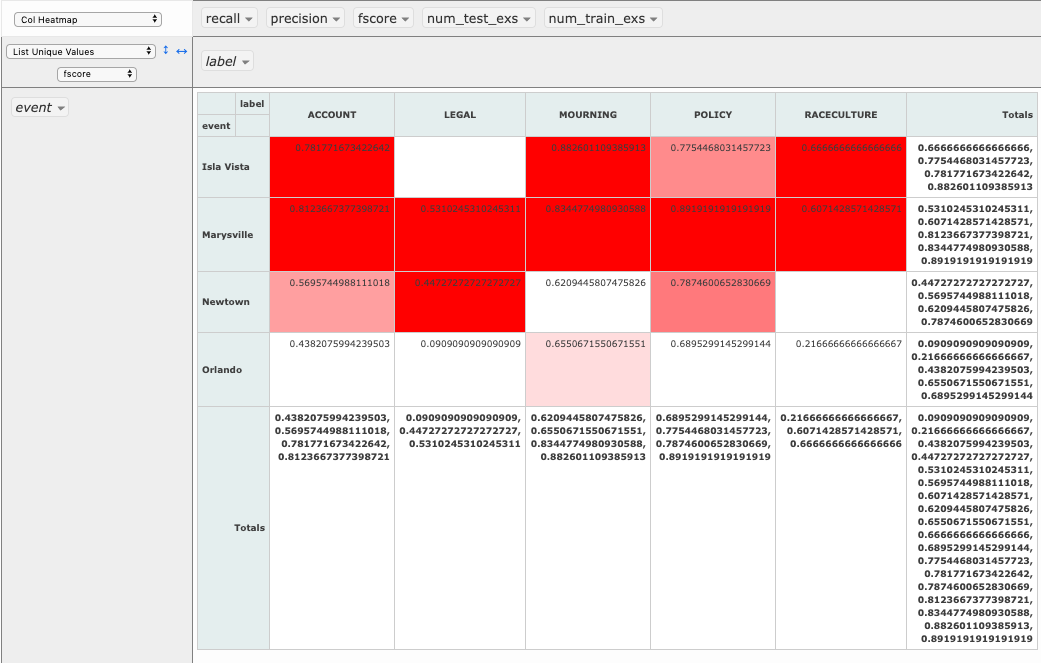
Another view that is interesting is the heatmap, that shades cells of the table darker for better fscores, this can be configured as shown in the image below.
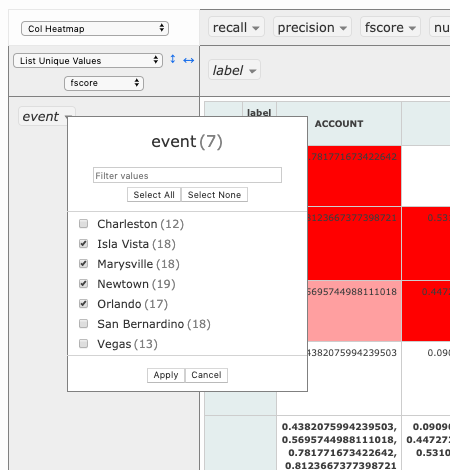
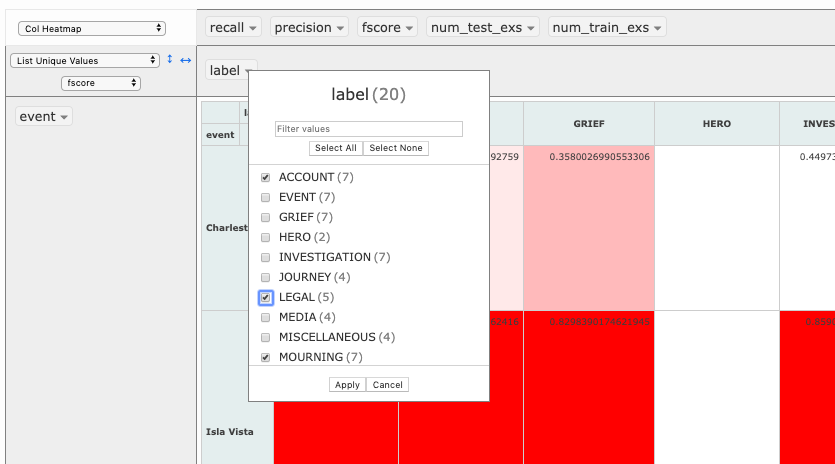
Finally, there is also the option to filter by any event or label as desired, and this can be done as shown in the following two images.
To use the interactive visualizations for the events, click the following two links.
Results from Full Data
The results from all events together are shown in the following table, with both the sentence based results, and the excerpt based results.
This table identifies which f-scores, precision and recall values were the best, and compares the sentence based and excerpt based results. The colour green indicates good performance and red indicates poor performance. It is nice to see that by far MISCELLANEOUS label had the worst performance. Another thing to note, is that these results show that overall recall does fairly well. This means that the classifiers are performing well at identifying the excerpts as having the correct label. The lower precision indicates that it is returning too many results (i.e. too many false positives). This could be a good thing in this application, since the false positives may actually be true positives due to errors or inconsistencies in the annotations. Also, in this application it may be better to bring to attention more of the results rather than less, since it may be better to identify more cases relevant to the label, as opposed to missing too many of them.